Webカメラでインターバル撮影
Webカメラでインターバル撮影を行ってみました。

最初は一眼レフのインターバル機能で撮影をしていたのですが、そういえば、linuxであればcronとWebカメラを使えば同様のことができるのでは? ってことでやってみました。
最終的にこんな感じの動画を作ることができます。www.youtube.com
#1日中撮影すると結構おもしろいかも
静止画撮影もできる fswebcam のインストール
$ sudo apt-get install fswebcam
作業ディレクトの作成とキャプチャー用シェルの新規作成
$ mkdir /var/www/captureImage
$ sudo chmod 777 /var/www/captureImage
$ sudo emacs /var/www/captureImage/captureImage.sh
記述する内容はこちら
出力するファイル名あたりはお好みで
#!/bin/bash

DATE=$(date +"%Y%m%d%H%M%S")

fswebcam -r 640x480 --no-title --no-banner --no-shadow /var/www/captureImage/$DATE.jpg
実行権限の付加
$ sudo chmod +x /var/www/captureImage/captureImage.sh
クローンで定期実行(1分ごとに)
$ crontab -e
*/1 * * * * /var/www/captureImage/captureImage.sh
#emacs派な自分にはviが立ち上がるので面倒ですが、そこは気合で
これで1分ごとにカメラからの静止画が /var/www/captureImage/ ディレクトリに追加されていきます。
あとは convert や ffmpeg などで動画化してあげれば変化の様子が分かるかと思います。
ffmpegのインストールと静止画から動画
通常通りインストールすると面倒らしいので motion からffmpegをインストール
$ sudo apt-get -y install motion
ffmpeg用にキャプチャーした画像ファイルのリンクを連番で作成(これめんどい)
$ c=1 ; for i in ??????????????.jpg ; do ln $i `printf %d $c`.jpg ; c=$((c+1)) ; done
静止画から動画に変換
$ sudo ffmpeg -f image2 -r 15 -i %d.jpg -r 15 -an -vcodec libx264 -pix_fmt yuv420p video.mp4
Raspberry PiとArduinoを使って、温度、湿度、土壌測定
もうぼちぼち、梅雨入りをし、湿気に悩まされる季節になってきたかと思います。
この時期になると、湿気と温度から不快指数を求めたくもなります。
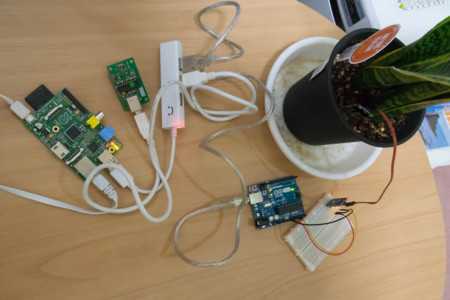
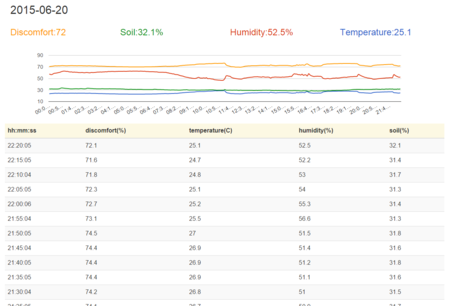
今回は、Raspberry PiとArduinoを使って、温度、湿度、土壌測定してみました。
こんな感じに接続
こんな感じにグラフ表示
必要な機材
本体のRaspberry Piwww.amazon.co.jp
温度・湿度センサー(ちょと高い)
https://strawberry-linux.com/catalog/items?code=52001
土壌センサーから値を取得するためのArduinowww.amazon.co.jp
土壌センサー(安い)www.amazon.co.jp
湿度・温度の測定
こちらを参考にしてくださいませ。
基本的には usbrh プログラムを作れればよいかと思います。mugimugi.hatenablog.com
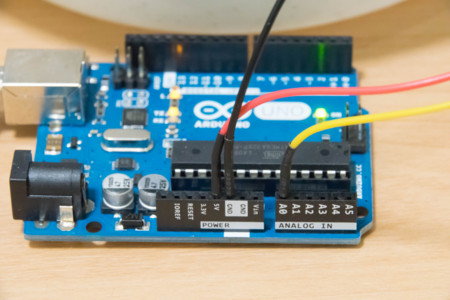
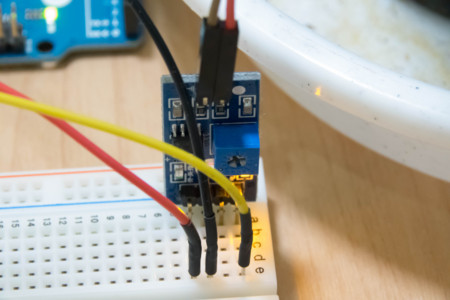
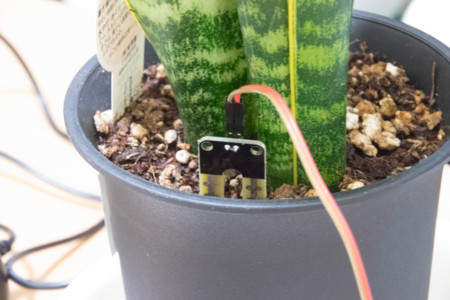
土壌センサーの配線
配線はシンプルで、電源と、アースと、読み込むアナログ端子を接続するだけです。
Arduinoプログラム
Arduinoに書き込むプログラムはこちら(ほとんど、サンプルプログラムのままです)
この辺はRaspberry PiよりもWindowsで書き込んだほうがラクな気がします。
/*
  AnalogReadSerial
  Reads an analog input on pin 0, prints the result to the serial monitor.
  Attach the center pin of a potentiometer to pin A0, and the outside pins to +5V and ground.

 This example code is in the public domain.
 */

// the setup routine runs once when you press reset:
void setup() {
  // initialize serial communication at 9600 bits per second:
  Serial.begin(9600);
}

// the loop routine runs over and over again forever:
void loop() {
  // read the input on analog pin 0:
  int sensorValue = analogRead(A0);
  // print out the value you read:
  Serial.println(sensorValue);
  delay(1000);        // delay in between reads for stability
}
Raspberry PiからArduinoのシリアルデーターを読む
こちらを参考
LINUX間通信の準備
ttyAMA0.c
File Edit Options Buffers Tools C Help
#include <stdio.h>
#include <stdlib.h>
#include <unistd.h>
#include <fcntl.h>
#include <string.h>
#include <termios.h>
#include <time.h>

#define DEV_NAME    "/dev/ttyACM0"
//#define DEV_NAME    "/dev/ttyUSB0"
#define BAUD_RATE    B9600
#define BUFF_SIZE    4096

void serial_init(int fd)
{
  struct termios tio;
  memset(&tio,0,sizeof(tio));
  tio.c_cflag = CS8 | CLOCAL | CREAD;
  tio.c_cc[VTIME] = 100;

  cfsetispeed(&tio,BAUD_RATE);
  cfsetospeed(&tio,BAUD_RATE);

  tcsetattr(fd,TCSANOW,&tio);
}


int main(int argc,char *argv[]){

  int fd;
  int i,j;
  int len;
  int cnt = 0;
  unsigned char buffer[BUFF_SIZE],in_data[BUFF_SIZE];
  fd = open(DEV_NAME,O_RDWR);
  if(fd<0){
    printf("open failed\n");
    perror(argv[1]);
    exit(1);
  }
  serial_init(fd);
  j = 0;
  //  printf("start\n",argv[0]);
  while(1){

    len=read(fd,buffer,BUFF_SIZE);
    if(len==0){
      continue;
    }
    if(len < 0){
      printf("%s: ERROR\n",argv[0]);
      perror("");
      exit(2);
    }

    for(i=0; i<len; i++){
      //  printf("%02X ",buffer[i]);
      in_data[j++] = buffer[i];
    }
    if((in_data[j - 1] == 0x0a) || (in_data[j - 1] == 0)){
      in_data[j - 1] = 0x0a;
      in_data[j] = 0;
      if( cnt == 2 ){
        //        printf("\n read-data=%s\n",&in_data[0]);
printf("%s",&in_data[0]);
        exit(2);
      }
      cnt += 1;
      write(fd,&in_data[0],strlen(&in_data[0]));
      j = 0;
    }
  }
}
なんでかArduinoから得られるデーターが、途中のバイトもそのまま表示されるので、1回目の取得データーをスルーして、2回目のデーターを取得表示するようにしています。
$ gcc ttyAMA0.c -o ttyAMA0
実行
$ ttyAMA0
グラフ表示プログラム
グラフ描画のソースコードはこちら
<?php

//グラフ表示
if( $_GET['m'] == "" ){

  echo <<<HTML
<html>
<head>
  <script src="//code.jquery.com/jquery-1.11.3.min.js"></script>
  <script src="//code.jquery.com/jquery-migrate-1.2.1.min.js"></script>
  <link rel="stylesheet" href="//maxcdn.bootstrapcdn.com/bootstrap/3.3.4/css/bootstrap.min.css">
  <link rel="stylesheet" href="//maxcdn.bootstrapcdn.com/bootstrap/3.3.4/css/bootstrap-theme.min.css">
<style type="text/css">
#temperature{
  color:#3366cc;
}
#humidity{
  color:#dc3912;
}
#discomfort{
  color:#ff9900;
}
#soil{
  color:#109618;
}
</style>
  <script src="//maxcdn.bootstrapcdn.com/bootstrap/3.3.4/js/bootstrap.min.js"></script>
  <script type="text/javascript"
          src="https://www.google.com/jsapi?autoload={
            'modules':[{
              'name':'visualization',
              'version':'1',
              'packages':['corechart']
            }]
          }"></script>
  <script type="text/javascript">
$(function(){


  //初期化関数
  var init = function(){

    initAjax();
    setInterval(function(){

      initAjax();

    },1000 * 60 * 5  );

  };

  //小数点○桁目を四捨五入
  var myRound = function(val, precision){

    digit = Math.pow(10, precision);
    val = val * digit;
    val = Math.round(val);
    val = val / digit;

    return val;

  };

  //初期Ajaxリクエスト
  var initAjax = function(){

    //APIから測定データー取得
    $.getJSON( "./index.php?m=api" , function(json){

      //タイトル挿入
      $("#resultLatestDate").text(json[0]["mdatetime"].split(" ")[0] );
      $("#resultLatestSoil").text( myRound( json[0]["soil"] , 1 ) );
      $("#resultLatestTemperature").text( myRound( json[0]["temperature"] , 1 ) );
      $("#resultLatestHumidity").text( myRound( json[0]["humidity"] , 1 ) );
      var discomfortIndex = 0.81 * json[0]["temperature"] + 0.01 * json[0]["humidity"] * ( 0.99 * json[0]["temperature"] - 14.3 ) + 46.3;
      $("#resultLatestDiscomfortIndex").text( parseInt( discomfortIndex ,10 ) );

      //表の作成
      var len = json.length;
      var html = "";
      for( var i = 0 ; i < len ; i ++ ){

        html += "<tr><td>" + json[i].mdatetime.split(" ")[1] + "</td><td>" + myRound( json[i].discomfort , 1 )+ "</td><td>" + myRound( json[i].temperature , 1 ) + "</td><td\
>" + myRound( json[i].humidity , 1 ) + "</td><td>" + myRound( json[i].soil , 1  ) + "</td></tr>";

      }
      $( "#resultTable tbody" ).html( html );

      //グラフの描画
      drawChart(json);

    });

  };

  //グラフの描画
  var drawChart = function(json){

    //配列の作成
    var dataArr = [ ['date', 'Temperature', 'Humidity' , 'Discomfort' , 'soil' ] ];
    var i = json.length;
    while( i -- ){

      dataArr.push( [ json[i].mdatetime.split(" ")[1] , parseFloat( json[i].temperature ) , parseFloat( json[i].humidity ) , parseFloat( json[i].discomfort ) , parseFloat( \
json[i].soil ) ] );

    }

    //Googleチャートでグラフの描画
    var data = google.visualization.arrayToDataTable( dataArr);
    var options = {
      curveType: 'function',
      legend: 'none'
    };
    var chart = new google.visualization.LineChart(document.getElementById('curve_chart'));
    chart.draw(data, options);

  }

  //ライブラリ読み込み時実行
  google.setOnLoadCallback(init);

});
</script>
</head>
<body>
<div class="container">
  <h2 id="resultLatestDate"></h2>
  <div class="row">
    <div class="col-sm-3"><h3 id="discomfort">Discomfort:<span id="resultLatestDiscomfortIndex"></span></h3></div>
    <div class="col-sm-3"><h3 id="soil">Soil:<span id="resultLatestSoil"></span>%</h3></div>
    <div class="col-sm-3"><h3 id="humidity">Humidity:<span id="resultLatestHumidity"></span>%</h3></div>
    <div class="col-sm-3"><h3 id="temperature">Temperature:<span id="resultLatestTemperature"></span></h3></div>
  </div>
  <div id="map_weather"></div>
  <div class="row">
    <div id="curve_chart"></div>
    <br/>
  </div>
  <div id="result" class="row">
    <table id="resultTable" class="table table-striped">
      <thead>
      <tr class="warning">
        <th>hh:mm:ss</th>
        <th>discomfort(%)</th>
        <th>temperature(C)</th>
        <th>humidity(%)</th>
        <th>soil(%)</th>
      </thead>
      <tbody></tbody>
    </table>
  </div>
</div>
</body>
</html>
HTML;

}
//API
elseif( $_GET['m'] == "api" ){

  $link = mysql_connect('localhost', 'root', '');
  $db = mysql_select_db('raspberry', $link);

  //グラフ描画用データーの取得
  if( $_GET['type'] == "" ){

    //MySQLからデーター取得
    $sql = "
SELECT
  *
FROM
  usbrh_data
WHERE
  mdate = CURRENT_DAT
ORDER BY
  id DESC
;";
    $result = mysql_query( $sql );
    $json_arr = array();
    while( $val = mysql_fetch_assoc( $result ) ){
      array_push( $json_arr, $val );
    }
    header("Content-Type: application/javscript; charset=utf-8");
    echo json_encode( $json_arr );
    exit;

  }
  //測定データーをMySQLに挿入(cronなどを使って定期的にこちらを叩きます)
  elseif( $_GET['type'] == "insert" ){

    //湿気・温度測定
    $result_arr =explode( " " , exec("usbrh") );
    $temperature = e( $result_arr[0] );
    $humidity    = e( $result_arr[1] );
    $discomfort  = e( 0.81 * $temperature + 0.01 * $humidity * ( 0.99 * $temperature - 14.3 ) + 46.3 );

    //土壌測定
    $soil = e( 100 - ( intval( exec("ttyAMA0") ) / 1024 * 100 ) );

    //挿入
    $sql = "
INSERT INTO
  usbrh_data
(
  soil        ,
  discomfort  ,
  temperature ,
  humidity    ,
  mdate       ,
  mdatetime   ,
  print
)VALUES(
  '{$soil}'        ,
  '{$discomfort}'  ,
  '{$temperature}' ,
  '{$humidity}'    ,
  CURRENT_DATE()   ,
  NOW()            ,
  '1'
);";
    $result = mysql_query( $sql );
    exit;

  }

}

//エスケープ関数
function e( $val ){

  return mysql_real_escape_string($val);

}
データー格納用のMySQL
CREATE TABLE IF NOT EXISTS `usbrh_data` (
  `id` int(11) NOT NULL,
  `soil` float NOT NULL,
  `discomfort` float NOT NULL,
  `temperature` float NOT NULL,
  `humidity` float NOT NULL,
  `mdate` date NOT NULL,
  `mdatetime` datetime NOT NULL,
  `print` int(11) NOT NULL DEFAULT '1'
) ENGINE=MyISAM
javascript で Kinect v2 for Windows を扱う
Kinect v2 for Windows がjavascriptで簡単に扱えるようになっていたので紹介
windows用のkinect2SDKをインストール
何はともあれまずは windows 用の kinect v2 SDK をインストールします。
Download Kinect for Windows SDK 2.0 from Official Microsoft Download Center
#公式のSDKのサンプルプログラムでの開発は、visual studioが必須だったりと、あまり現実的でなかった記憶が・・・
nodejsのインストール
今回使う kinect2 というライブラリは nodejs 上で動作しますのでインストールします。
Node.js
kinect2ライブラリをダウンロード
そして、メインの kinect2 ライブラリをダウンロードします(Download ZIPをクリック)。github.com
必要なパッケージをインストール
ZIPファイルを解凍すると、フォルダの中にpackage.jsonがありますので必要なパッケージをまとめてインストールします。package.jsonがある場合、npm installでライブラリをまとめてインストールしてくれるんですね。これ便利です。
$ npm install
#単体でkinect2 のインストールをする場合はこちら
$ npm install kinect2
サンプルプログラムの起動
examplesフォルダにサンプルプログラムがありますので、そちらを起動します。
$node examples/depth-feed-browser/index.js
あとは、ブラウザで表示されるURL(http://localhost:8000)にアクセスすれば動作を確認できます。
color-feed-browser-lwip-hackはnpm installが通らなかったけど、それ以外は動作したので、ちょっと遊んでみるにはいいのかも
参考記事
何やら単体でのkinect2 for windowsはなくなりxbox用のと変換アダプターを買ってねっとのことjapanese.engadget.com
www.amazon.co.jp
www.amazon.co.jp
Andorid2.3でも画像などのファイルをAjaxっぽく画面遷移なしにアップロードする方法
Andorid2.3の標準ブラウザではajax送信時に便利なFormDataでの画像添付や、画像をbase64化してテキストとして送信するFileReaderが使えません。
ですので、一見、画像遷移なしに画像の送信ができそうにありませんが、formのtargetにiframeを指定することで画面遷移なしでファイルをアップロードすることができるようになります。
ファイル送信用(index.html)
<html>
<head>
  <script type="text/javascript" src="jquery.js"></script>
</head>
<body>

<script type="text/javascript">

//jqueryを使う場合のcallback指定方法
var callback = {};

$(function(){

  callback.yourFunction = function( message ){

    alert(message);

  }

});
</script>

<form target="iframe_upload" action="getAndShow.php" enctype="multipart/form-data" method="post">
  <input type="file" name="myFile"/>
</form>

<iframe name="iframe_upload" id="iframe_upload"></iframe>

</body>
</html>
ファイル受け取り用(getAndShow.php)
<?php

ob_start();
var_dump($_FILES);
$result = ob_get_contents();
ob_end_clean();

echo <<<HTML
<script type="text/javascript">
window.onload = function(){

 if(window.parent) {

  //iframeから見た親要素の関数を呼び出す
  window.parent.callback.yourFunction("{$result}");

 }

};
</script>
HTML;
facebookのタイムラインを根こそぎ持ってくる
facebookの特定ページのタイムラインを根こそぎ持ってくる方法です。
まずは、タイムライン情報の取得に必要なApp IDとApp Secretをディベロッパーページより作成し、取得します。
<?php

//
$app_id = ""; //App ID
$secret_id = ""; //App Secret

//
$want_face_book_page_id = ""; //取得したいfacebookページの https://www.facebook.com/xxxxx のxxxxの部分

//
$access_token = file_get_contents("https://graph.facebook.com/oauth/access_token?client_id={$app_id}&client_secret={$secret_id}&grant_type=client_credentials");
$url = "https://graph.facebook.com/{$want_face_book_page_id}/posts?".$access_token;

$res = file_get_contents($url);
file_put_contents("facebook_timeline_{$want_face_book_page_id}_0.json",$res);

$cnt = 1;
$res = json_decode($res, TRUE );

while( $res["paging"]["next"] ){

  $res = file_get_contents($res["paging"]["next"]);
  file_put_contents("facebook_timeline_{$want_face_book_page_id}_{$cnt}.json",$res);

  $res = json_decode($res, TRUE );

  $cnt ++;

}